
👋 About Me
Hi, I’m Sheryl Xu. I hold a Master of Science degree in Integrated Marketing Communications from Northwestern University, and a Bachelor’s in Film and Media Studies from Washington University in St. Louis.
I’m a Digital Marketing and Data Science professional with hands-on experience in paid media, affiliate marketing, and MarTech. I’m proficient in SQL, Excel, R, and Tableaufor large-scale data analysis. I’m passionate about transforming complex data into actionable insights recommendations that drive brand growth and scalable decision-making.
Education
- M.S. in Integrated Marketing Communications, Northwestern University, Dec 2025
- B.A. in Film and Media Studies, Minor in Computer Science, Washington University in St.Louis, May 2024
Career Interests
- Marketing Analytics, Marketing Mix Modeling, and MarTech
- Digital Marketing & Paid Media
- Business Intelligence & Data Analytics
💼 Work Experiences
- 2025.06 - 2025.08, Graduate Marketing Analyst Intern @ Lincoln Financial
- 2025.02 - 2025.05, Marketing Consultant @ Creative Capitol
- 2022.08 - 2024.05, Assistant Research Analyst @ Washington University in St. Louis under Prof. Zhao Ma
- 2023.06 - 2023.08, Marketing Intern @ ShopShops
- 2021.05 - 2021.07, Strategy and Analytics Intern @ BlueFocus
- 2020.05 - 2020.07, Marketing Intern @ WE Marketing Group
🔧 Technical Skills
| Category | Tool(s) | |
|---|---|---|
| 1 | Data Analysis | |
| 2 | Data Visualization | |
| 3 | Design | |
| 4 | IDEs | |
| 5 | CRM & Automation | |
| 6 | Intelligence & Analytics |
📝 Projects
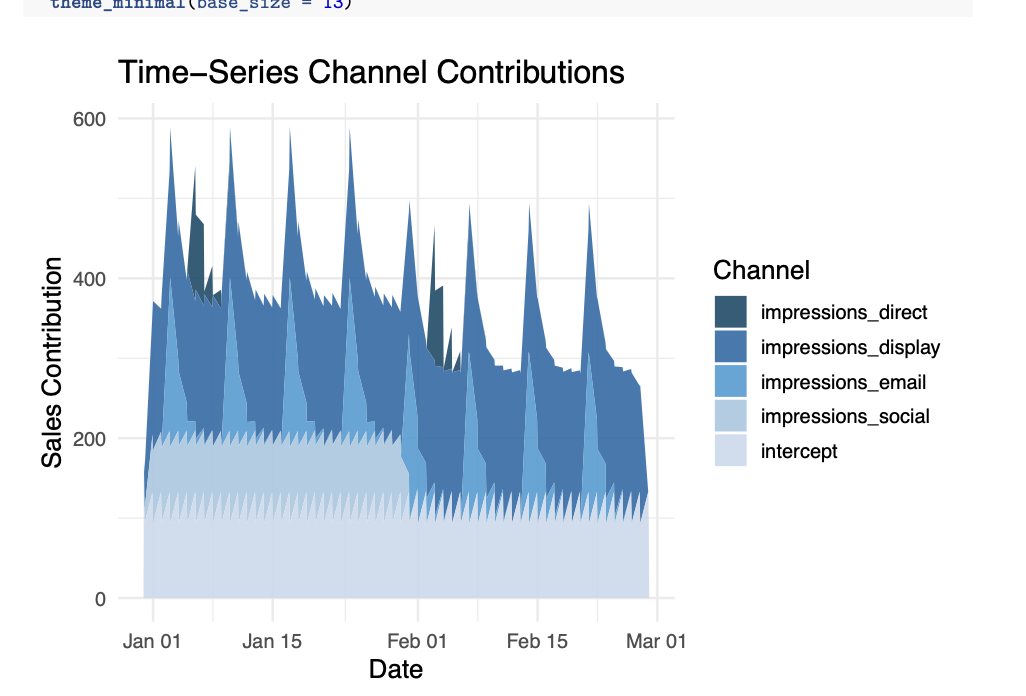
MMM: Optimizing Media Budget with Meta Robyn
This project applies time-series Marketing Mix Modeling (MMM) using Meta’s Robyn package to quantify the contribution of paid media channels and optimize budget allocation. Using an educational dataset developed by Professor Elea Feit at Drexel Univeristy, the project reveals that direct and email impressions drive the highest ROI, while social media underperforms relative to spend. The analysis provides actionable insights for reallocating marketing budgets to maximize efficiency.
- Key Methods and Tools: Marketing Mix Modeling, Meta Robyn, Bayesian Optimization, Geometric Adstock, Saturation Curves, Time-Series Aggregation, ROI Analysis
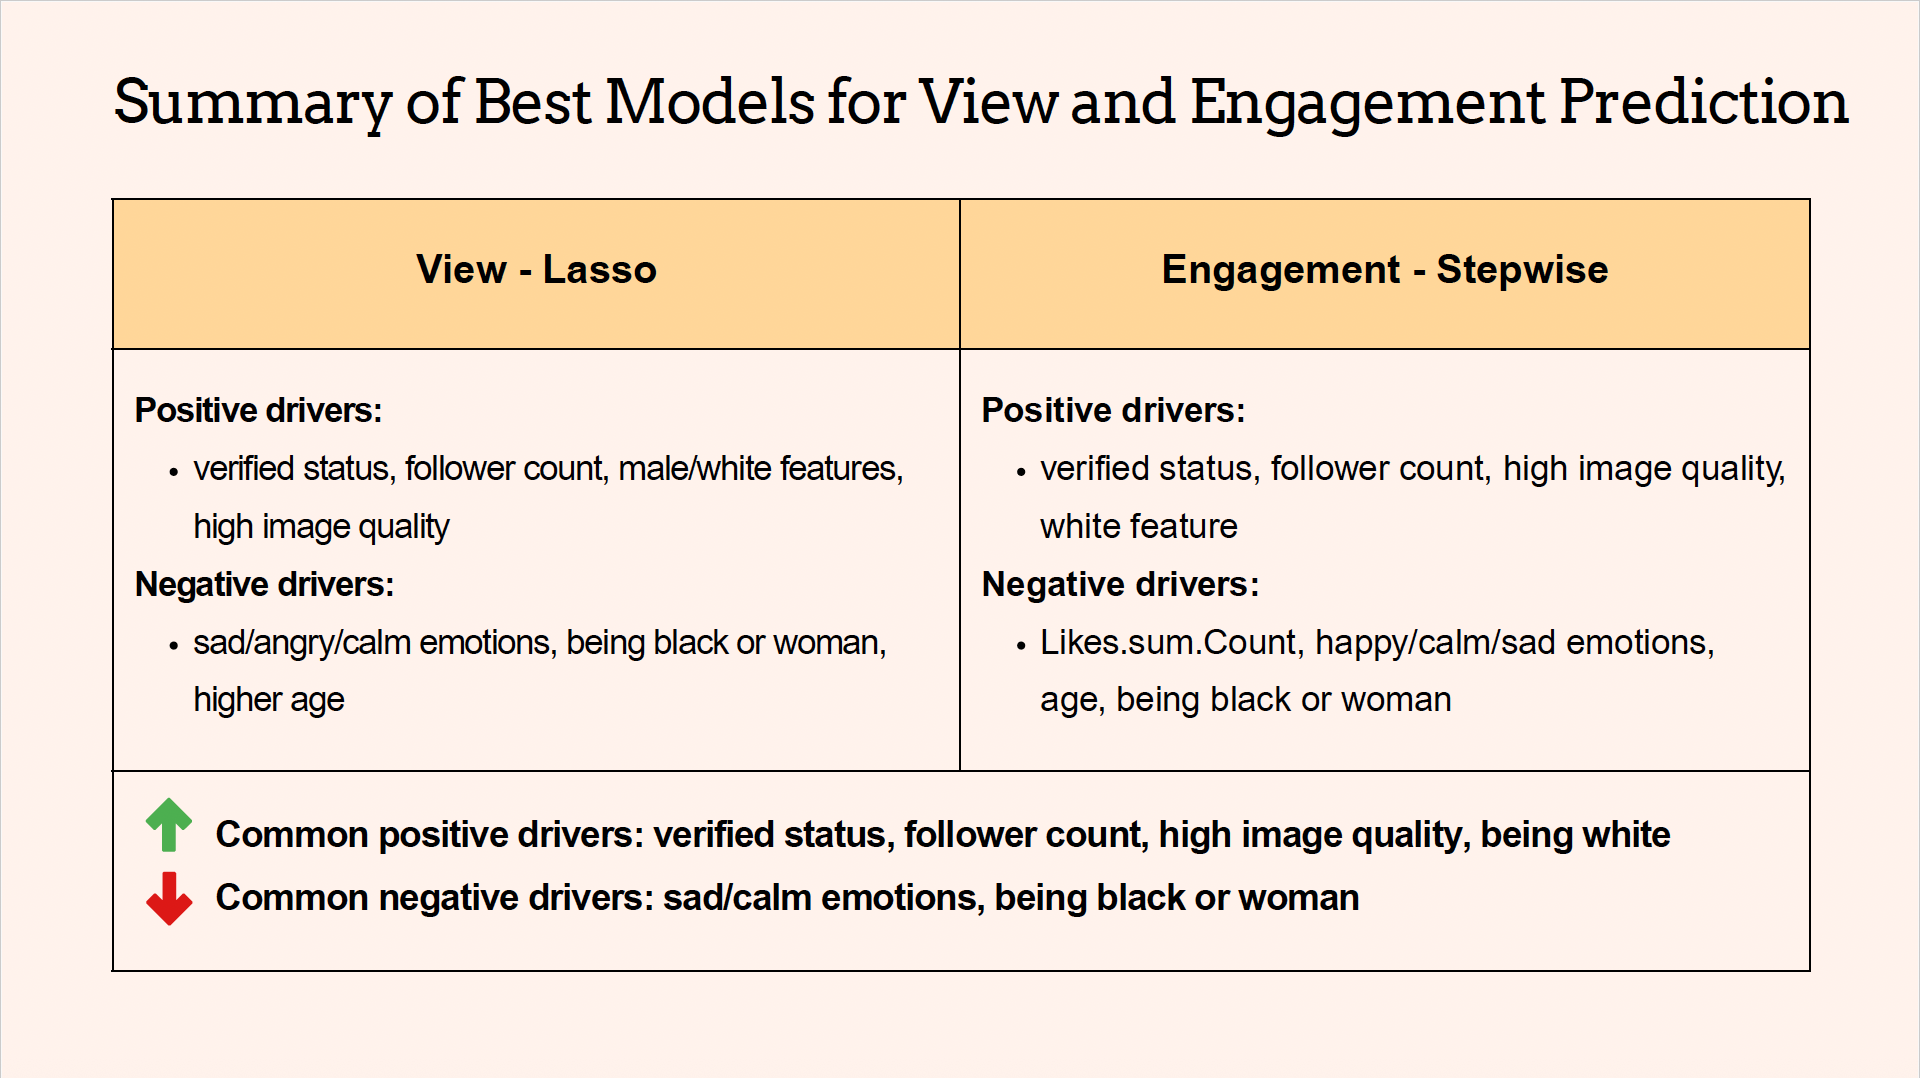
Machine Learning: Predicting Tiktok Video Engagement & Virality
This project builds machine learning and statistical models on TikTok influencer data—combining follower count, verification status, video quality, detected emotions, caption sentiment, and demographics—to predict reach and engagement. Results shows that prioritizing verified, high-follower creators, enhancing visuals, and amplifying underrepresented creators can boost content performance and foster a more inclusive platform strategy.
Code Unavailable due to Data Privacy Slides
- Key Methods and Tools: Multiple Linear Regression, Stepwise Variable Selection with Cross-Validation, Lasso Regression, Principal Component Analysis (PCA), Train/Test Split
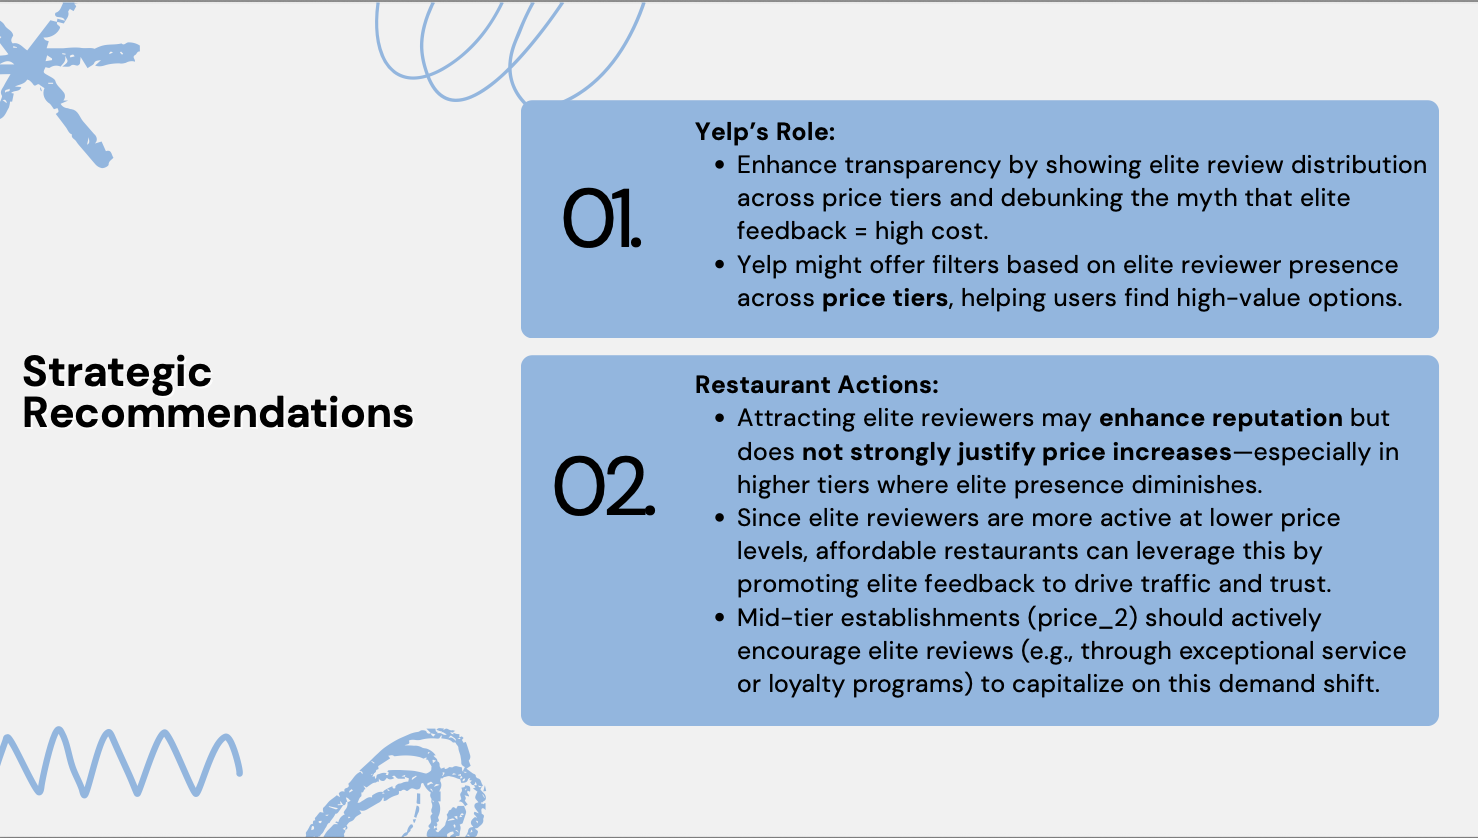
Machine Learning: Predictive Modeling & Marketing Insights from Yelp Data
This project applies machine learning and statistical modeling to Yelp restaurant data to uncover actionable insights for marketing strategy, business operations, and consumer engagement. Building on these insights, I developed predictive models to determine the likelihood of a restaurant being operational—an essential component for optimizing Yelp’s delivery service.
- Key Methods and Tools: Logistic Regression, Linear and Polynomial Regression, Interaction Terms & Model Diagnostics, Model Selection, ROC, AUC, and Threshold Optimization, Bootstrapping & Cross-Validation
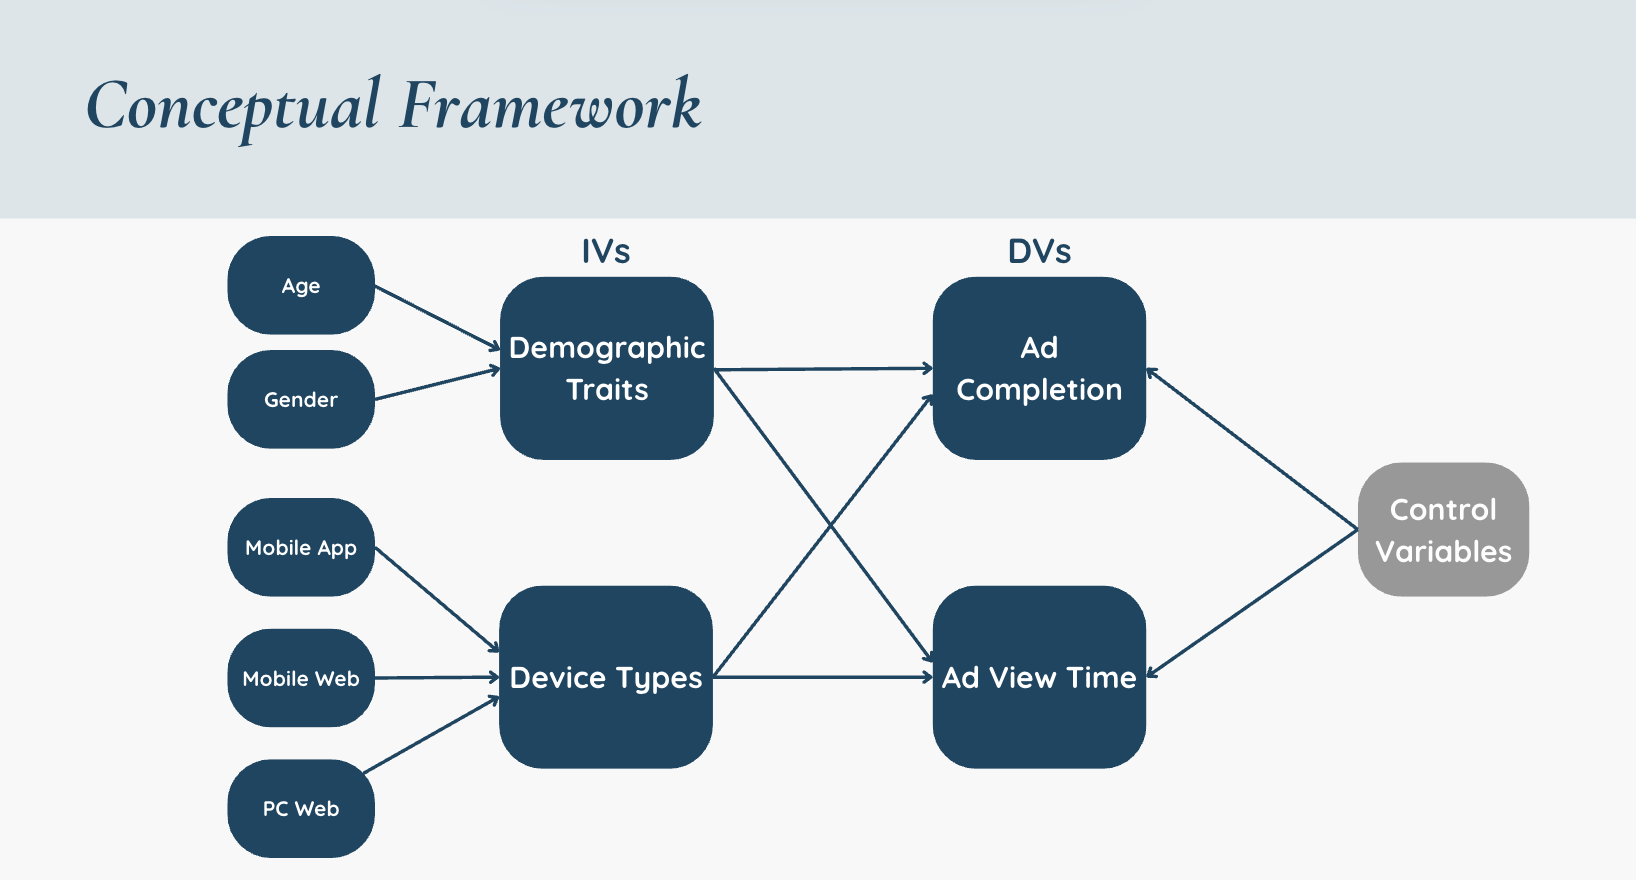
Marketing Models: Influence of Device and Demographics on Pre-Roll Ad Engagement
This project applies statistical modeling on a dataset of 10,000 user sessions from a South Korean portal to quantify how device type and demographics influence pre-roll ad engagement. I implemented and compared linear probability, logistic, probit, and interval regression models, revealing that PC web usage significantly increases ad completion rates and that older viewers watch ads longer.
- Key Methods and Tools: Linear Probability Model, Logistic and Probit Regression, Interval Regression
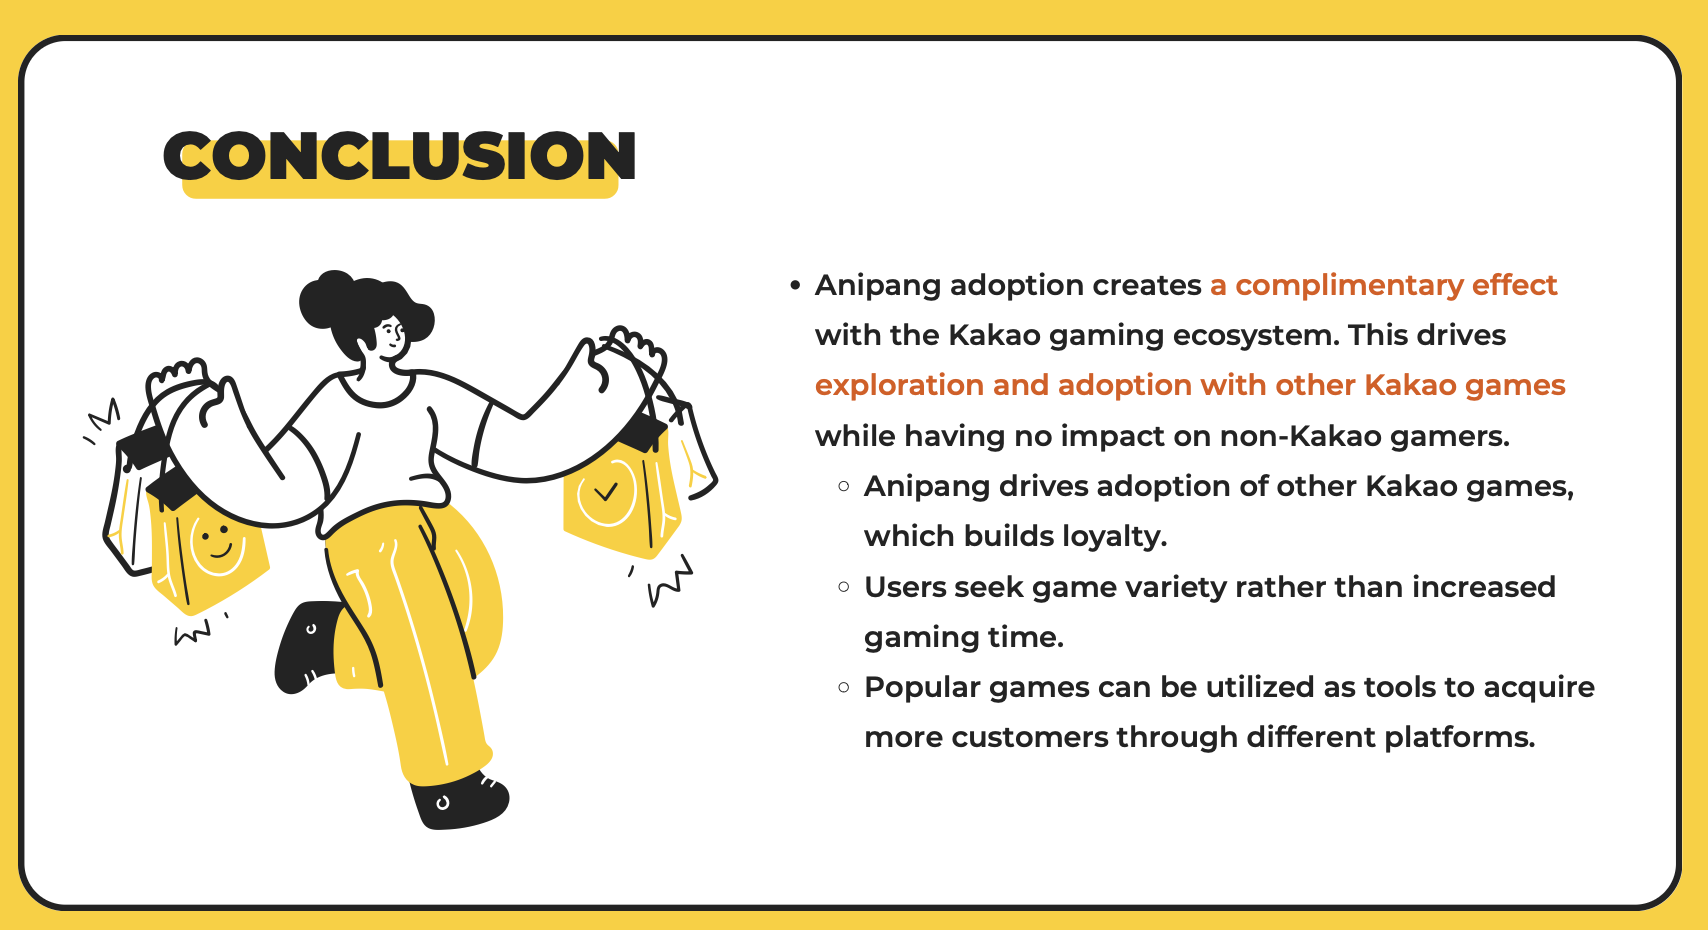
Marketing Models: The Impact of Anipang Adoption on Kakao Game Usage
This project applies propensity-score matching and panel difference-in-differences on weekly panel data of 849 Android users to quantify how adopting the hit game Anipang influences both time spent and number of other Kakao games played. I ran dummy-variable OLS and within-estimator fixed-effects regressions across ten matched samples, finding that Anipang adoption significantly boosts the number of Kakao games users engage with—but has no effect on total play time or spillovers to non-Kakao games.
- Key Methods and Tools: Propensity Score Matching(PSM), Dummy-variable Regression, One-way Fixed-Effects Panel Regression
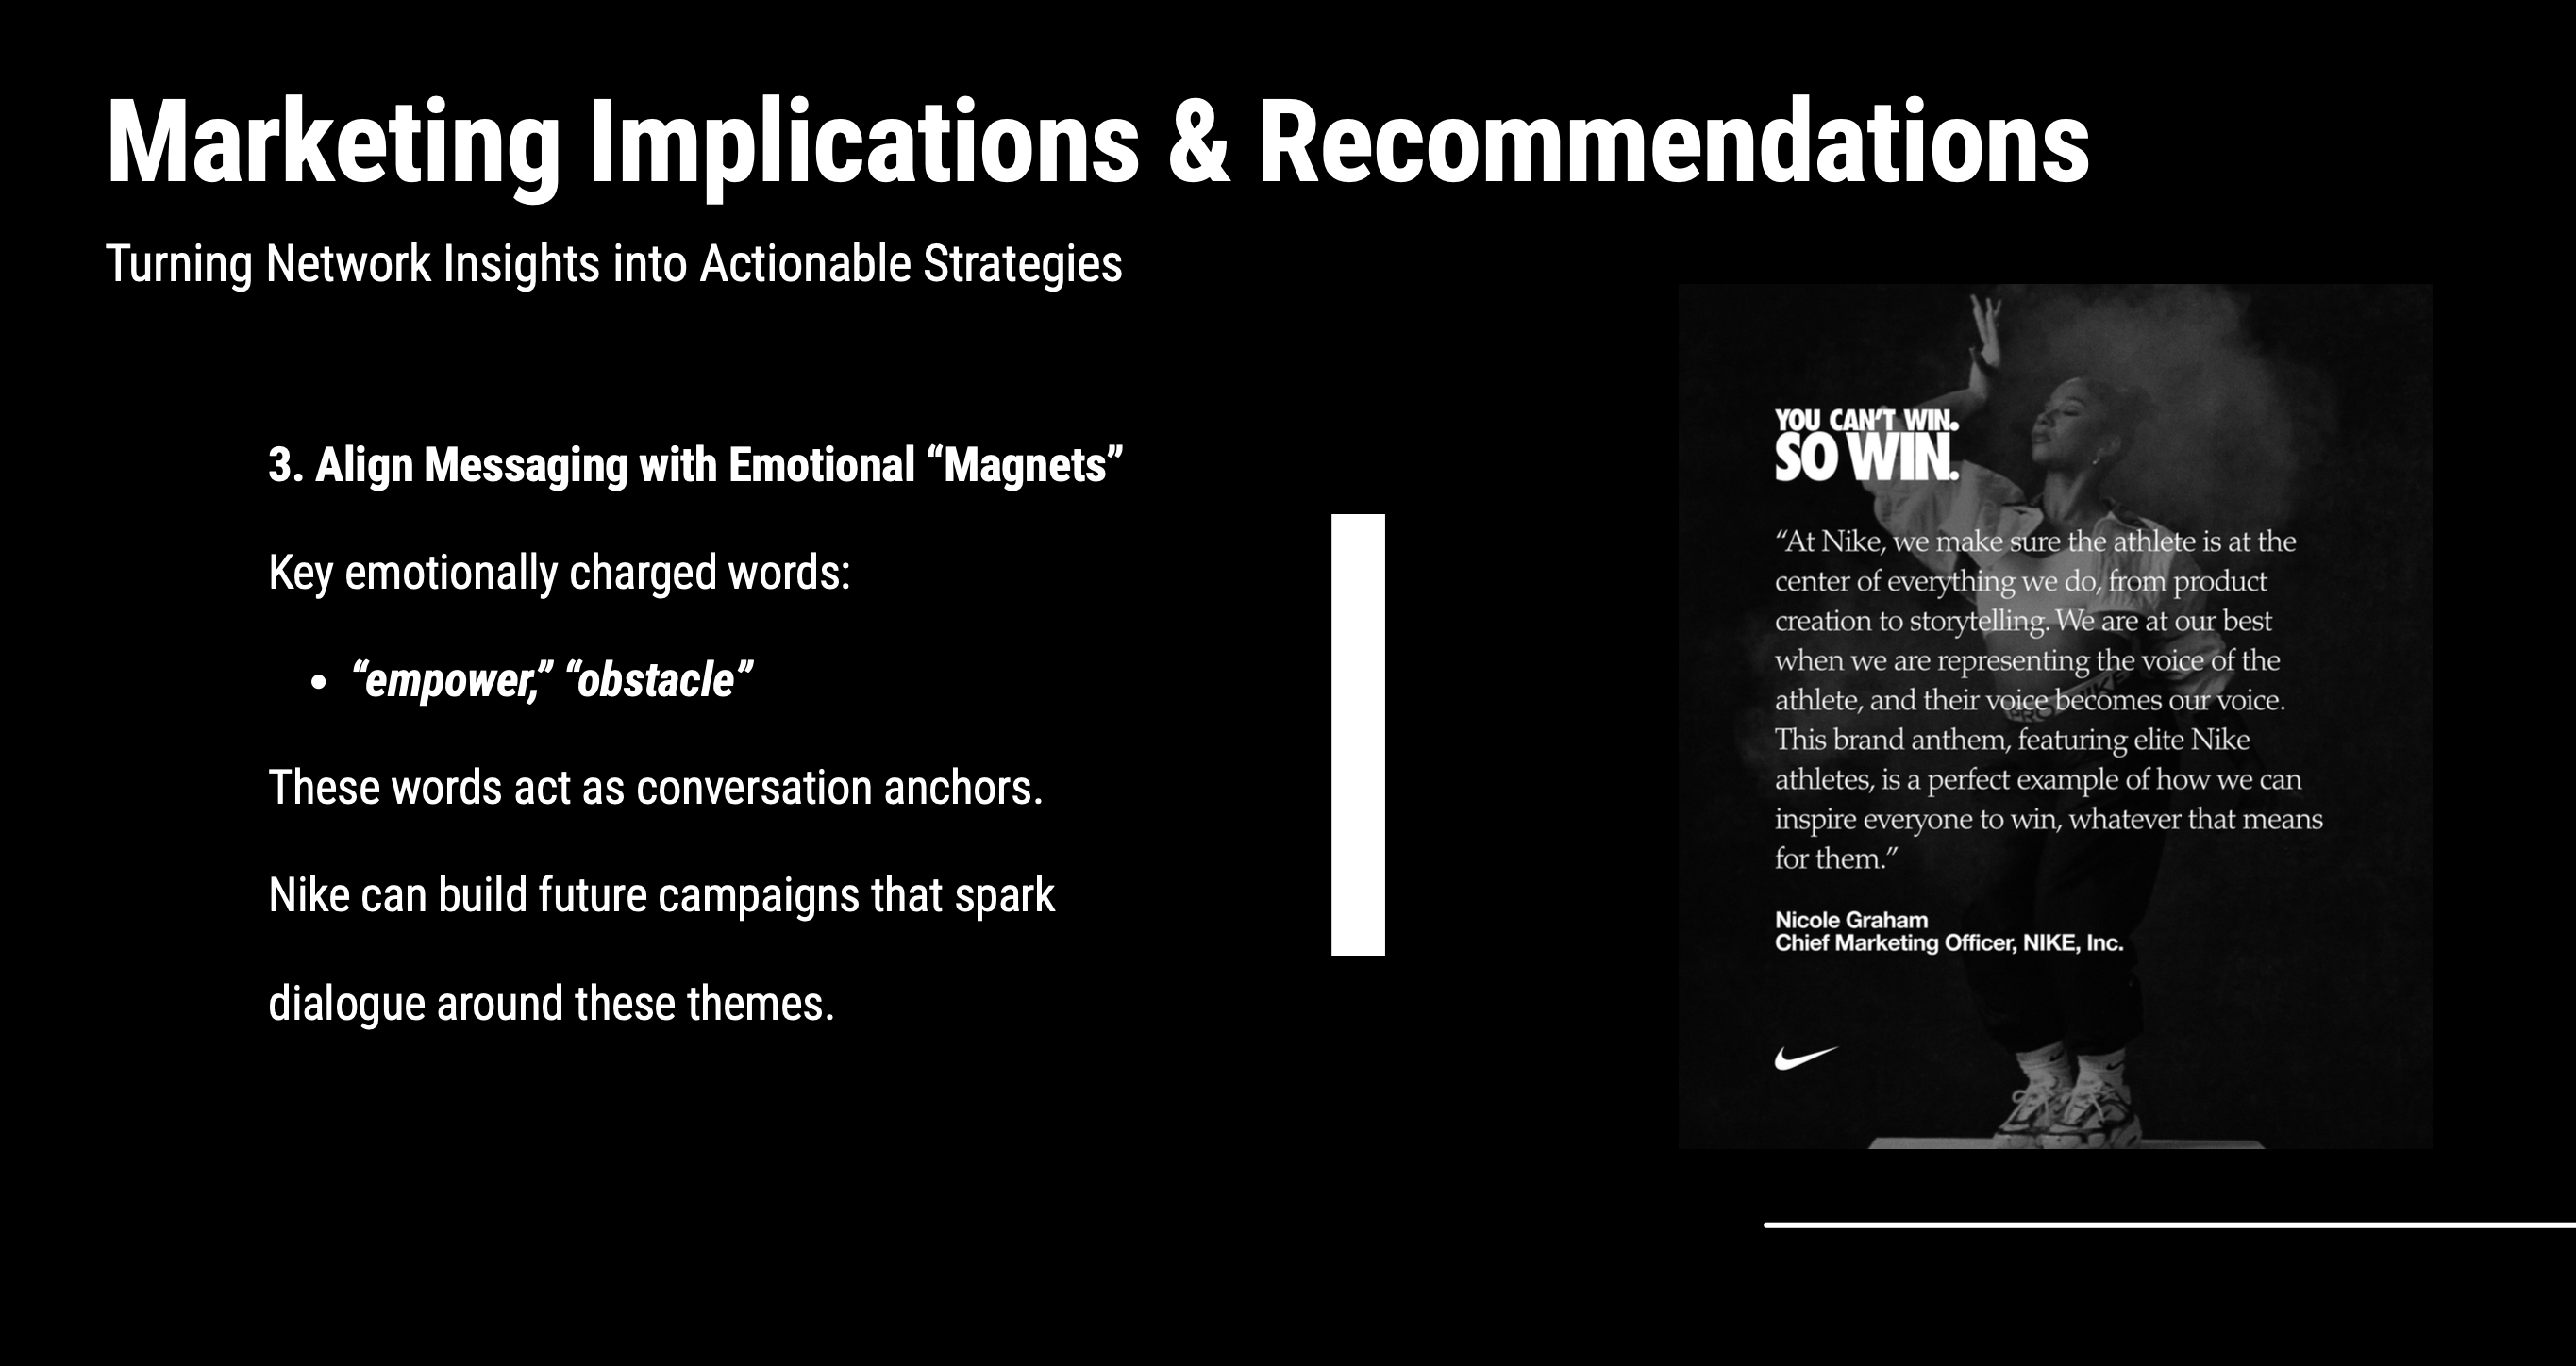
Social Network Analysis: Nike ‘So Win’ Campaign
This project mapped 1,095 YouTube comments on Nike’s Super Bowl “So Win” ad into interaction and sentiment networks, then used community detection, centrality analysis, and word co-occurrence to reveal how the conversation spread, where it clustered, and which themes—like “empower” and “obstacle”—drove engagement.
- Key Methods and Tools: Data Collection(Communalytic), Network Construction(Gephi), Network Metrics, Semantic Analysis
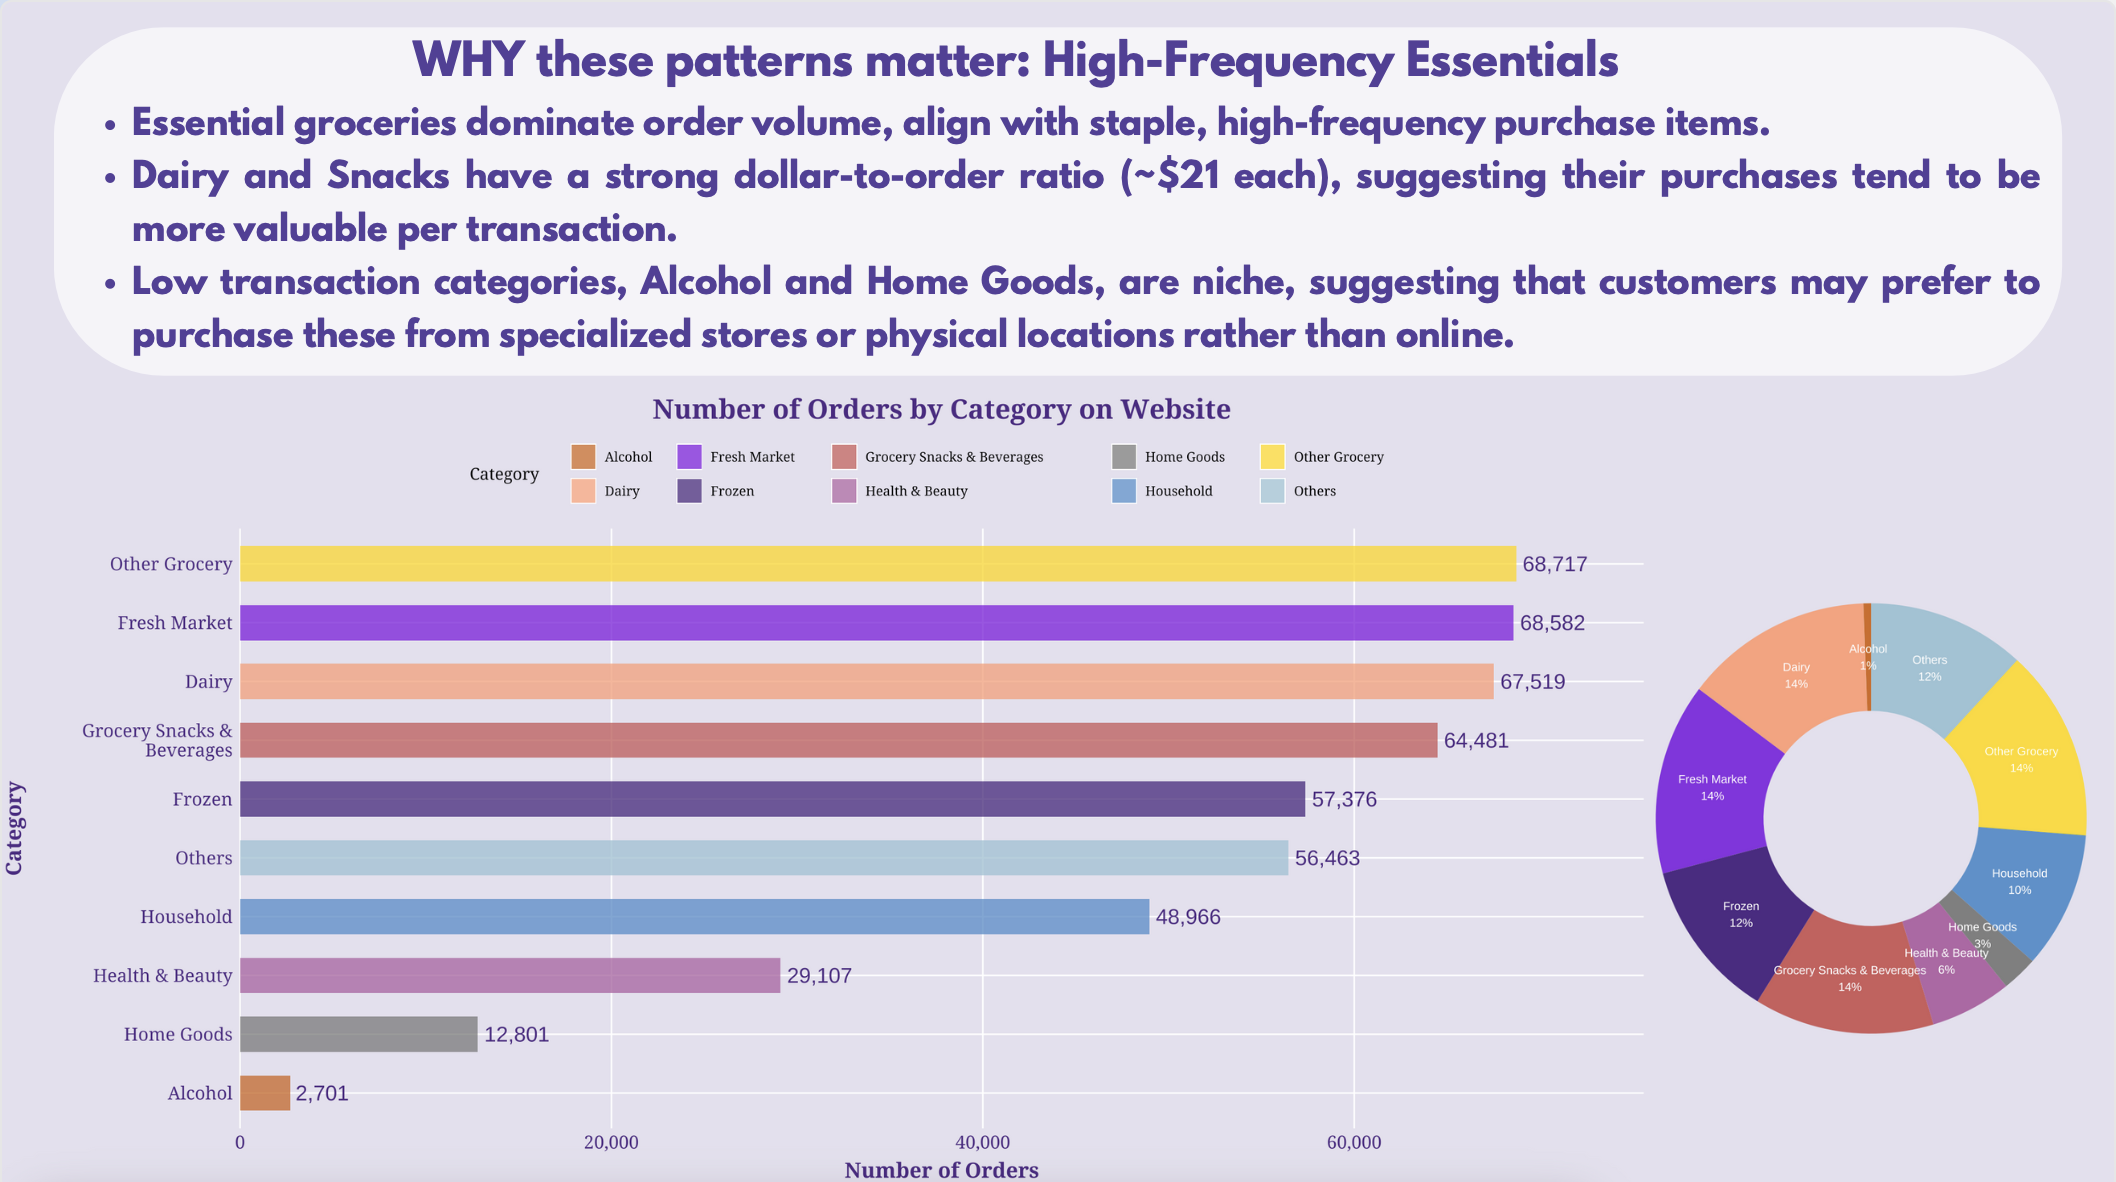
Data Visualization: Grocery Customer Transaction Trends
This project visualizes online grocery transactions to uncover customer purchasing patterns across devices, order size, product categories, and seasons. I used R libraries—showtext, scales, and lubridate—to uncover that Apple web users drove revenue, low-value frequent orders prevailed, fresh items dominated spend, and seasonality peaked, guiding targeted marketing, dynamic pricing, retention, and merchandising strategies.
- Key Methods and Tools: Data Wrangling, Feature Engineering, Visualization
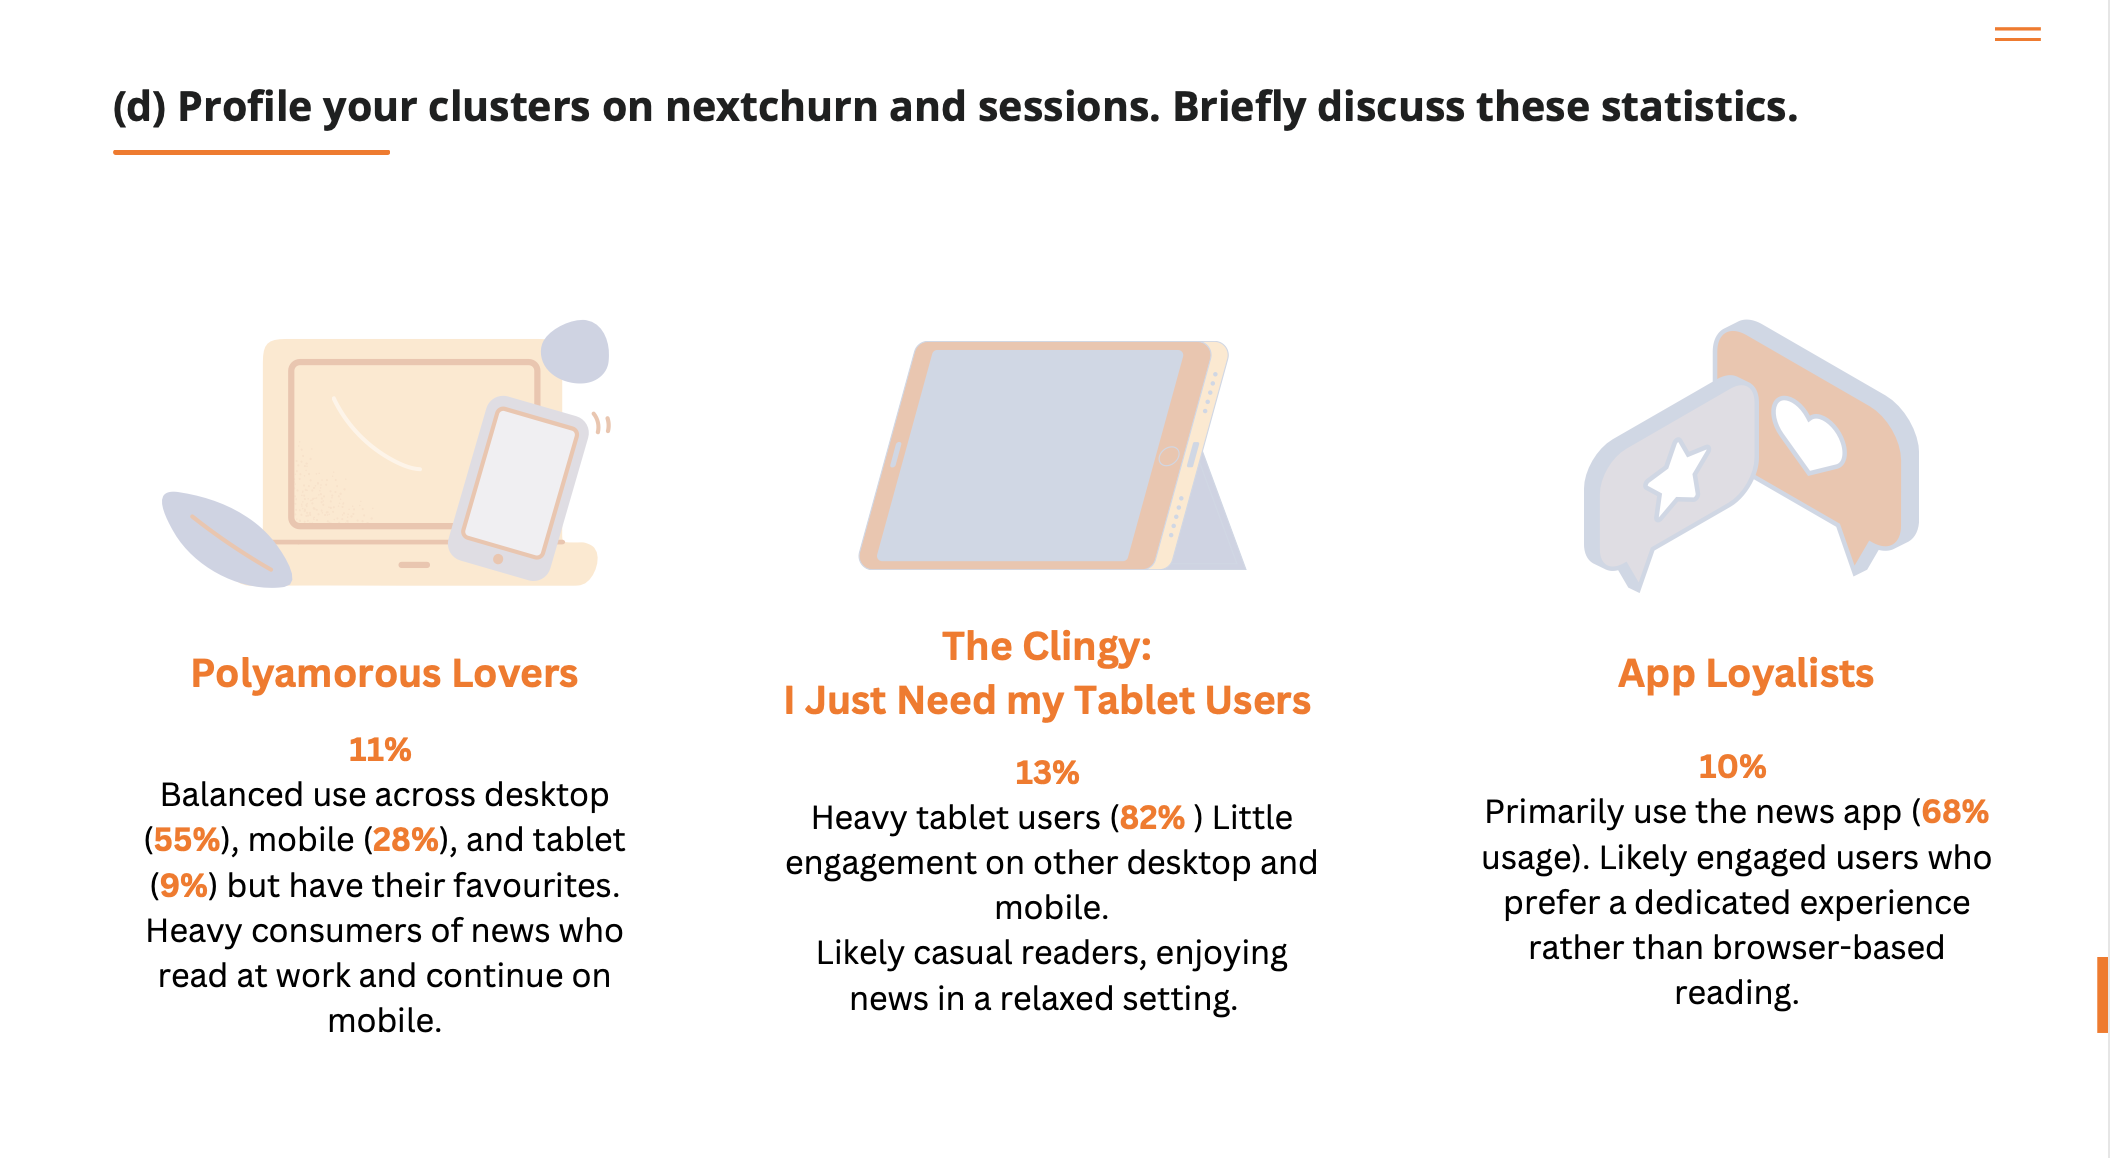
Clustering Analysis: Predicting Subscriber Churn from Device Usage
This project applies k-means clustering to five device-usage metrics for 10,000 news subscribers, identifying six distinct reader segments. A logistic regression model was then developed to predict next-month churn. High-risk segments (desktop-heavy, low-tenure users) were pinpointed, and personalized re-engagement campaigns and subscription offers were crafted.
- Key Methods and Tools: Data Preprocessing, Clustering(k-means), Profiling, Predictive Modeling